Using TimeKeeper with Telegraf/InfluxDB/Grafana (TIG stack)
The Telegraf/InfluxDB/Grafana (TIG) stack is a set of open source tools to collect, store and graph time series data. This document describes how to install and set up the TIG-stack for use with TimeKeeper. Collecting of the data can be done by Telegraf or directly by scripting. InfluxDB is used to store the data. Finally the data can be graphed or viewed using Grafana.
TimeKeeper has three types of log files:
- timekeeper (timekeeper.log on Windows) - central place for logging alarms, general messages, state change information and administrative information
- timekeeper_$SOURCE.data - one file per configured source
- timekeeperclients/ - directory of per-host and per-source data files for each reporting client
More information on TimeKeeper’s log files can be found in the “File formats” section.
InfluxDB
InfluxDB is an open source time series database. TimeKeeper provides excellent integration with InfluxDB. In this first section, we’ll see how TimeKeeper can stream time samples to InfluxDB as it collects them from sources. To enable streaming, you must at minimum configure the IP address to your InfluxDB v1 HTTP API endpoint. The endpoint must have TLS enabled (a self-signed certificate is permissible). More details on how to set up TLS are provided below. By default, TimeKeeper will use 8086 as the TCP port and ‘timekeeper_db’ as the database / storage bucket. These values are configurable. If you have authentication enabled with InfluxDB, you must configure the username and password. The password is stored in TimeKeeper’s configuration file as an encrypted string. Use TimeKeeper’s encodepassphrase tool to encrypt the password, or simply set it via the web interface - it will encode the password for you. Below is an example encoding the password “influxdb” using the encodepasshrase tool. To hide the passphrase from command history, omit the PASSPHRASE assignment from the command below and enter it later on at the prompt instead:
PASSPHRASE=influxdb /opt/timekeeper/release64/encodepassphrase
/FdfibQTiP5RvBTxF+q6SA==
To enable TLS with InfluxDB using a self-signed certificate, follow these steps. This example is based on InfluxDB 1.8. More information is available at https://docs.influxdata.com/influxdb/v1/administration/https_setup/.
- Generate a cert/key pair:
openssl req -x509 -newkey rsa:4096 -keyout /etc/ssl/influxdb.key -out /etc/ssl/influxdb.crt -days 730 -nodes
When prompted, fill in the fields for your Country Name, Organization, and so on.
- Edit the InfluxDB configuration file (/etc/influxdb/influxdb.conf) and modify / un-comment these lines:
https-enabled = true
https-certificate = "/etc/ssl/influxdb.crt"
https-private-key = "/etc/ssl/influxdb.key
- Re-start InfluxDB. To test TLS connectivity, run this curl command:
curl -vk https://<IP ADDRESS>:8086/health
If all is well, you’ll see a JSON response with the message “ready for queries and writes”. Errors about “record exceeded the maximum permissible length” indicate TLS is not working. Ensure the user running InfluxDB has permissions to read the self-signed cert and key file, double check that the configuration file points to the cert and key file (and enables https), and ensure the service was successfully restarted.
In the next section, we’ll explore how to read data fields from TimeKeeper via a script and export them to InfluxDB. The InfluxDB reference manual is available at https://docs.influxdata.com. These examples and documentation apply to version 1.8 of InfluxDB and you may need to adjust depending on the distribution in use.
The influx API is available on port 8086 by default. Here is an example query:
curl -G http:/127.0.0.1:8086/query?pretty=true --data-urlencode "q=show databases"
Below is an example bash script to process a specific timekeeper data file and import it into InfluxDB.
#!/bin/bash
DB=timekeeper_db
DB_SERVER="http://127.0.0.1:8086"
CURL_OPTS="-w %{http_code} -s -o /dev/null"
FILE=${1}
if [ ! "$FILE" ] ; then
	echo Missing file name. Must be something like timekeeper_0.data.
	echo Usage: $0 FILENAME
	exit 1
fi
SOURCE=`basename ${FILE} | sed 's:timekeeper_::g' | sed 's:\.data::g'`
#
# Make sure we can access the InfluxDB
#
STATUS=`curl ${CURL_OPTS} -G  ${DB_SERVER}/query?pretty=true --data-urlencode "q=show databases"`
if [ $? != 0 ] ; then
	echo "Unable to access Database"
	exit 1
fi
#
# Drop timekeeper_db
#
STATUS=`curl ${CURL_OPTS} -i -XPOST ${DB_SERVER}/query --data-urlencode "q=drop database ${DB}"`
if [[ ${STATUS} != 200 ]] ; then
	echo "Status (${STATUS}) Not expected dropping database ${DB}"
	exit 1
fi
#
# Create timekeeper_db
#
STATUS=`curl  ${CURL_OPTS} -i -XPOST ${DB_SERVER}/query --data-urlencode "q=create database ${DB}"`
if [[ ${STATUS} != 200 ]] ; then
	echo "Status (${STATUS}) Not expected creating database ${DB}"
	exit 1
fi
#
# Write timekeeper data to db
#
while IFS= read LINE; do
	TIMESTAMP_1=`echo $LINE | awk '{ print $1 }' | sed 's:\.::g'`
	OFFSET_2=`echo $LINE | awk '{ print $2 }'`
	RAW_OFFSET_3=`echo $LINE | awk '{ print $3 }'`
	INTERNAL_4=`echo $LINE | awk '{ print $4 }'`
	CCF_5=`echo $LINE | awk '{ print $5 }'`
	ADD_DATA_GPS_6=`echo $LINE | awk '{ print $6 }'`
	ADD_DATA_GPS_7=`echo $LINE | awk '{ print $7 }'`
	INTERNAL_8=`echo $LINE | awk '{ print $8 }'`
	TS_TYPE_9=`echo $LINE | awk '{ print $9 }'`
	NET_DELAY_10=`echo $LINE | awk '{ print $10 }'`
	RAW_NET_DELAY_11=`echo $LINE | awk '{ print $11 }'`
	TIME_SRC_12=`echo $LINE | awk '{ print $12 }'`
	IDEAL_CCR_13=`echo $LINE | awk '{ print $13 }'`
	MODEL_ERROR_14=`echo $LINE | awk '{ print $14 }'`
	SRC_TRC_15=`echo $LINE | awk '{ print $15 }'`
	INTERNAL_16=`echo $LINE | awk '{ print $16 }'`
	UPSTREAM_ACC_17=`echo $LINE | awk '{ print $17 }'`
	INTERNAL_18=`echo $LINE | awk '{ print $18 }'`
	STATUS=`curl  ${CURL_OPTS} -i -XPOST "${DB_SERVER}/write?db=${DB}" --data-binary "tk_data,source=${SOURCE} offset_2=${OFFSET_2},raw_offset_3=${RAW_OFFSET_3},internal_4=${INTERNAL_4},ccf_5=${CCF_5},add_data_gps_6=${ADD_DATA_GPS_6},\
add_data_gps_7=${ADD_DATA_GPS_7},internal_8=${INTERNAL_8},ts_type_9=\"${TS_TYPE_9}\",net_delay_10=${NET_DELAY_10},raw_net_delay_11=${RAW_NET_DELAY_11},time_src_12=\"${TIME_SRC_12}\",\
ideal_ccr_13=${IDEAL_CCR_13},model_error_14=${MODEL_ERROR_14},src_trc_15=\"${SRC_TRC_15}\",internal_16=${INTERNAL_16} ${TIMESTAMP_1}"`
	if [[ ${STATUS} != 204 ]] ; then
			echo "Status (${STATUS}) Not expected adding record to database: ${DB}"
			exit 1
	fi
done < ${FILE}
Telegraf
Telegraf is an agent for collecting, processing, aggregating and writing metrics. Telegraf’s documentation can be found here: https://docs.influxdata.com/telegraf/. These examples apply to version 1.18 of Telegraf and can be adapted to your version as appropriate.
The Telegraf configuration file is located at: /etc/telegraf/telegraf.conf. To enable Telegraf to consume TimeKeeper logs you can use either the inputs.file or the inputs.tail plugins. Examples are available below.
Note: Only one type of plugin, either inputs.file or inputs.tail, should be used with the TimeKeeper logs.
The inputs.file section in telegraf.conf parses the complete contents of the file with the selected format. To import existing TimeKeeper data using Telegraf add the following to telegraf.conf:
[[inputs.file]]
  files = ["/var/log/timekeeper_0.data"]
  data_format = "csv"
  csv_timestamp_column = "ts_1"
  csv_timestamp_format = "unix"
  name_override = "tk_data"
  csv_header_row_count = 0
  csv_column_names = ["ts_1","offset_2","raw_offset_3","internal_4","ccf_5","add_data_gps_6","add_data_gps_7","internal_8","ts_type_9","net_delay_10","raw_net_delay_11","time_source_12","ideal_ccr_13","model_error_14","src_trc_15","internal_16","upstream_acc_17","internal_18","internal_19"]
  csv_column_types = ["float","float","float","float","float","float","float","float","string","float","float","string","float","float","string","float","float","float","float"]
  csv_delimiter = " "
  [inputs.file.tags]
    source = "0"
The inputs.tail section in telegraf.conf “tails” a file and parses each update. To continuously import the the TimeKeeper log file add the following to telegraf.conf:
[[inputs.tail]]
  files = ["/var/log/timekeeper"]
  from_beginning = true
  grok_patterns = ["%{NUMBER:ts:float}: %{GREEDYDATA:log}"]
  fielddrop = ["ts"]
  name_override = "tk_log"
  grok_custom_pattern_files = []
  grok_custom_patterns = '''
  '''
  data_format= "grok"
To continuously import the the TimeKeeper data file using the inputs.tail plugin add the following to telegraf.conf:
[[inputs.tail]]
files = ["/var/log/timekeeper_0.data"]
from_beginning = true
grok_patterns = ["%{NUMBER:ts_1:float} %{NUMBER:offset_2:float} %{NUMBER:raw_offset_3:float} %{NUMBER:internal_4:float} %{NUMBER:ccf_5:float} %{NUMBER:add_data_gps_6:float} %{NUMBER:add_data_gps_7:float} %{NUMBER:internal_8:float} %{DATA:ts_type_9} %{NUMBER:net_delay_10:float} %{NUMBER:raw_net_delay_11:float} %{DATA:time_source_12} %{NUMBER:ideal_ccr_13:float} %{NUMBER:model_error_14:float} %{DATA:src_trc_15} %{NUMBER:internal_16:float} %{NUMBER:upstream_acc_17:float} %{NUMBER:internal_18:float} %{NUMBER:internal_19:float}"]
fielddrop = ["internal_4", "internal_8", "internal_16", "internal_18", "internal_19"]
name_override = "tk_data"
grok_custom_pattern_files = []
grok_custom_patterns = '''
'''
data_format= "grok"
[inputs.tail.tags]
  source = "0"
To configure Telegraf to update a file use:
[[outputs.file]]
files = ["/tmp/telegraf.out"]
data_format= "influx"
To configure Telegraf to update and existing InfluxDB use:
[[outputs.influxdb]]
   urls = ["http://127.0.0.1:8086"]
   database = "timekeeper_db"
Note: The precise TimeKeeper timestamp may not be retained when importing data into InfluxDB using Telegraf. As configured this is intended to be used for visualization and analysis and not for regulatory reporting.
The telegraf utility is a command line tool to access Telegraf. A useful command for testing an updated telegraf.conf file is:
telegraf --debug --config telegraf.conf #(Use to validate and debug a Telegraf configuration file)
Grafana
Grafana is an open source data analytics and visualization web application. Grafana documentation can be found here: https://grafana.com/docs/. The examples and instructions provided below apply to version 7.5.2 but can be adopted to whatever version you’re using as needed.
Viewing TimeKeeper Logs and Data in Grafana
Enable the InfluxDB TimeKeeper data source
- In Configuration/Data Sources select Add data source and InfluxDB.
- Set the URL to be: http://localhost:8086
- Select the database to be timekeeper_db (Or the database used to import the TimeKeeper data)
- Use Save & Test to validate the Data source.
Create Dashboard and Panel to view TimeKeeper Data
- Create Dashboard
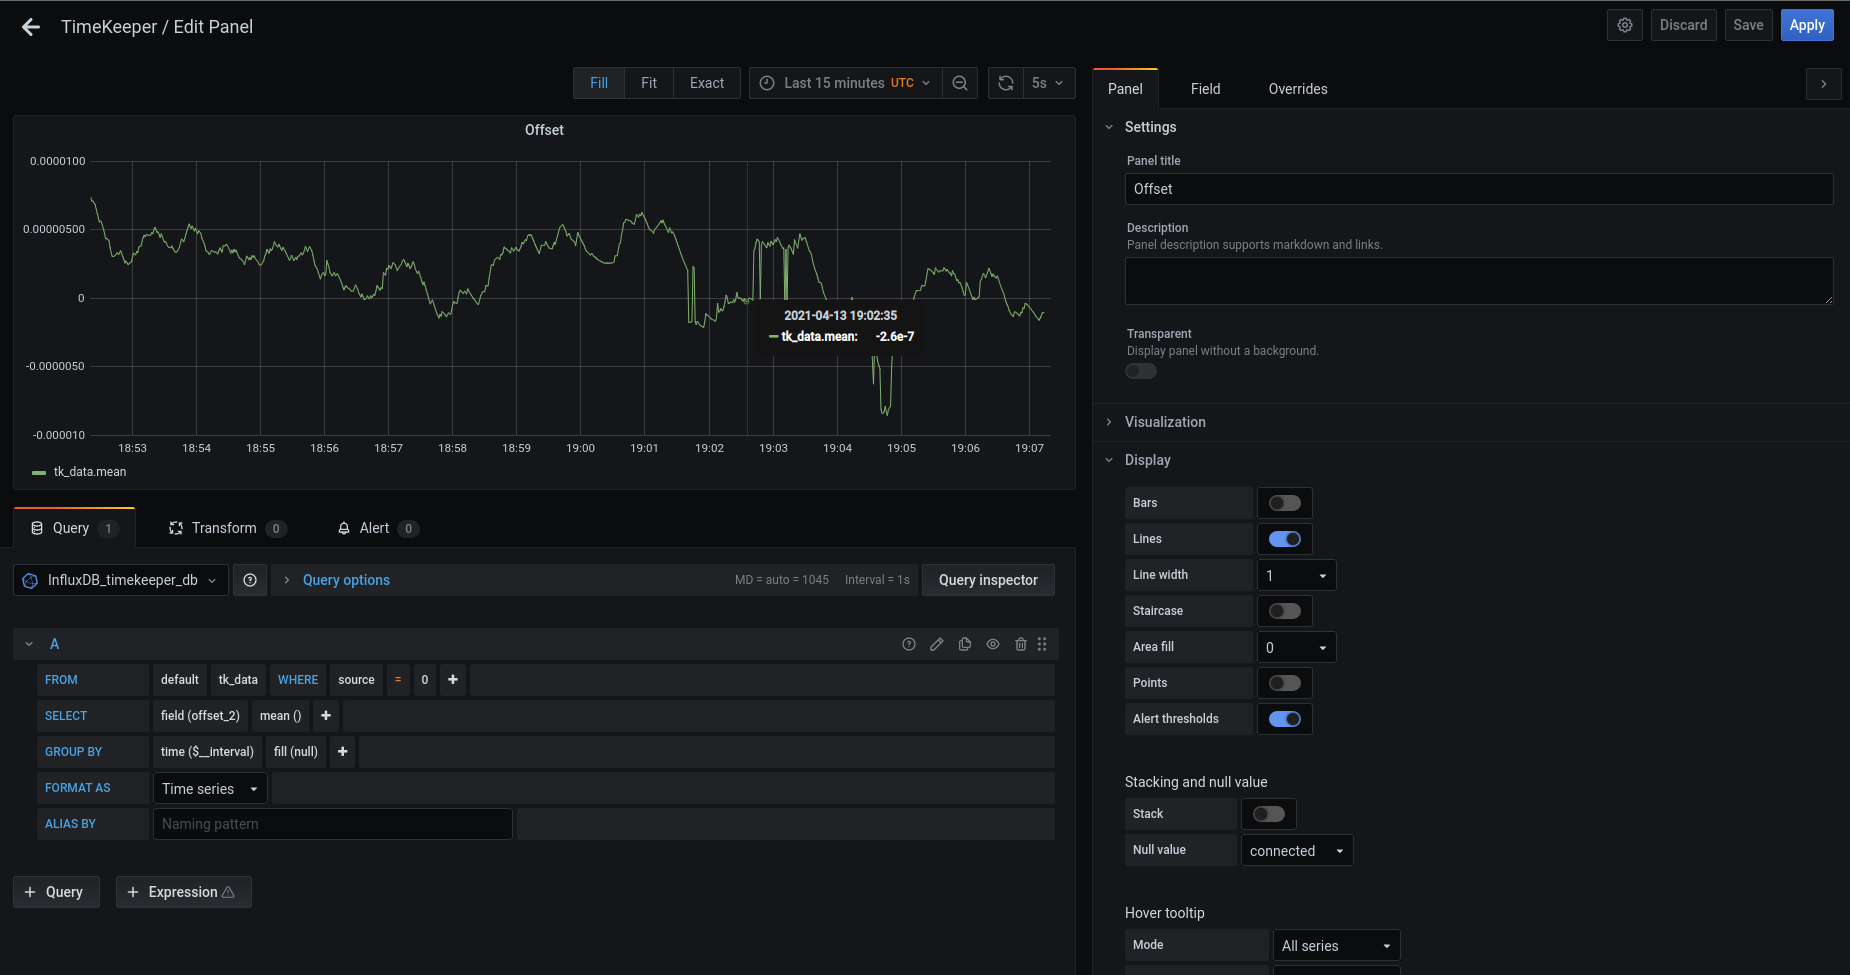
- Create Panel for Offset
- Use Visualization Graph
- For the Panel Title use Offset (In the configuration sidebar Panel under Settings)
- Set the “Area fill” 0 (In the configuration sidebar Panel under Display)
- Set the “Null Value” to Connected (In the configuration sidebar Panel under Display, see screenshot below). Note that these graph options may change in future versions of Grafana
- Axes/Left Y Unit Misc/Time/Seconds
- Ensure that the data source selected is the one created above
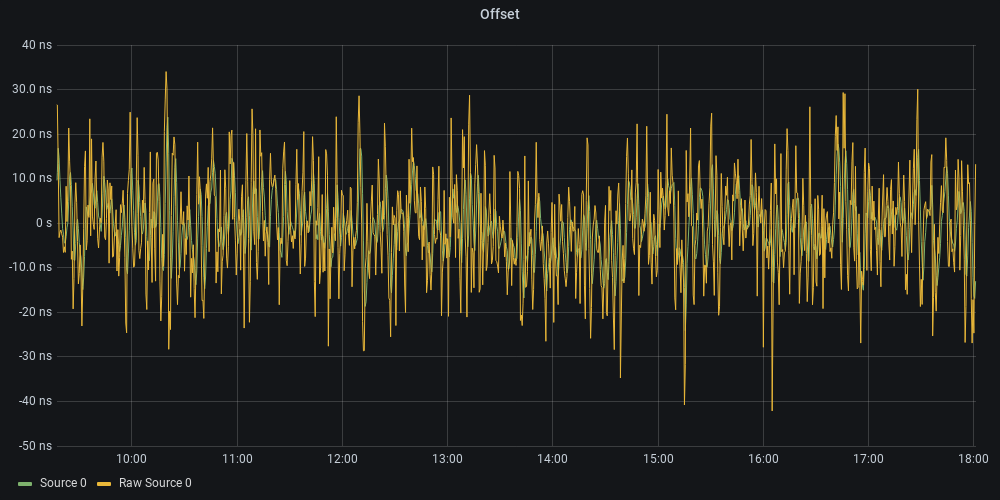
- For Accuracy(estimated offset) click on the pencil to toggle text edit mode and enter:
SELECT mean("offset_2") FROM "tk_data" WHERE ("source" = '0') AND $timeFilter GROUP BY time($__interval) fill(null) - Set the ALIAS BY to Source 0
- Use the “+ Query” button to create and additional query for the raw offset
- For Accuracy(raw offset) click on the pencil to toggle text edit mode and enter:
SELECT mean("raw_offset_3") FROM "tk_data" WHERE ("source" = '0') AND $timeFilter GROUP BY time($__interval) fill(null) - Set the ALIAS BY to Raw Source 0
- See example Offset panel below
- Create Panel for Network Delay/One way delay
- Use the settings above for the Panel
- For the Panel title use Network Delay of One way delay (This is available in the configuration sidebar under Settings)
- Set the “Area fill” 0 (In the configuration sidebar Panel under Display)
- Set the “Null Value” to Connected (In the configuration sidebar Panel under Display)
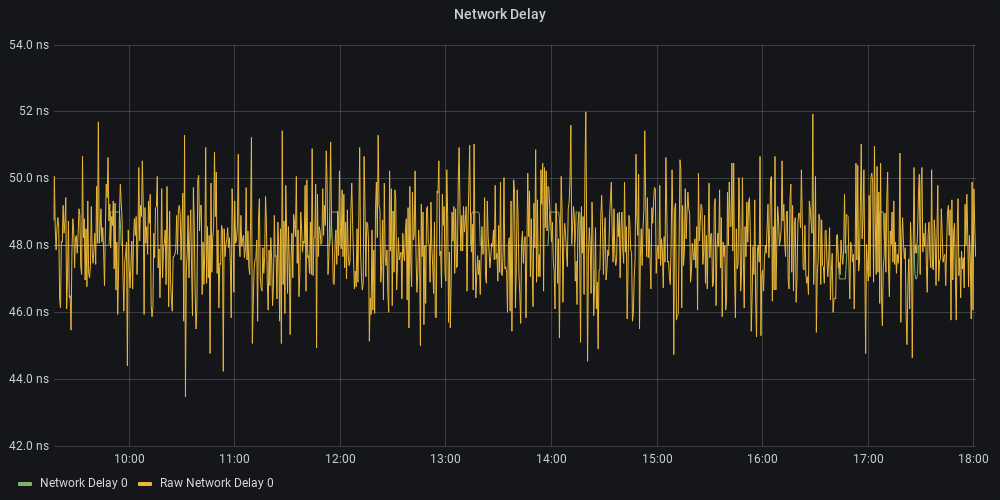
- For the calculated Network Delay/One way Delay use toggle text mode and enter:
SELECT mean("net_delay_10") FROM "tk_data" WHERE ("source" = '0') AND $timeFilter GROUP BY time($__interval) fill(null) - Set the ALIAS BY to Network Delay 0
- Use the “+ Query” button to create and additional query for the raw network delay
- For the raw Network Delay/One way Delay use toggle text mode and enter:
SELECT mean("raw_net_delay_11") FROM "tk_data" WHERE ("source" = '0') AND $timeFilter GROUP BY time($__interval) fill(null) - Set the ALIAS BY to Raw Network Delay 0
- See example Network Delay panel below
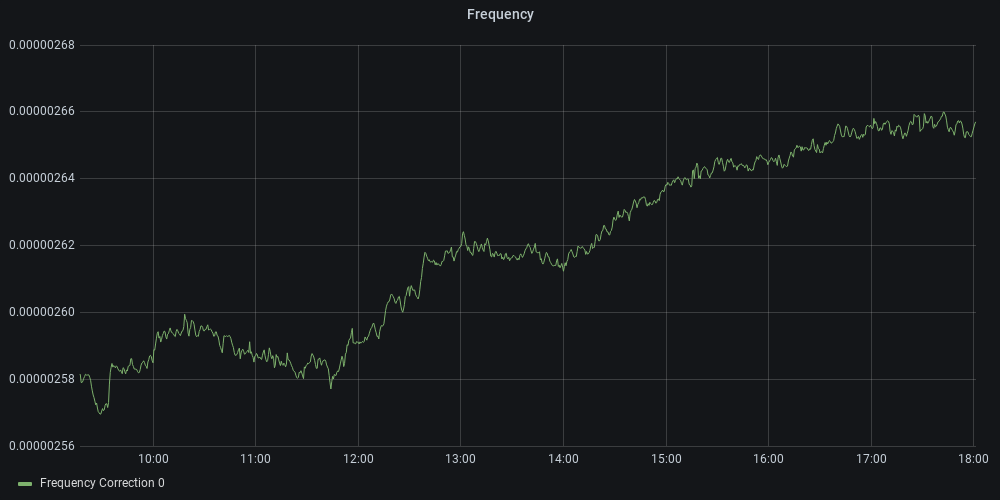
- Create Panel for Frequency
- Use Visualization Graph
- For the Panel title use Frequency (This is available in the configuration sidebar under Settings)
- Set the “Area fill” 0 (In the configuration sidebar Panel under Display)
- Set the “Null Value” to Connected (In the configuration sidebar Panel under Display)
- Set the ALIAS BY to Frequency Correction
- For the calculated Frequency Correction use toggle text mode and enter:
SELECT mean("ideal_ccr_13") FROM "tk_data" WHERE ("source" = '0') AND $timeFilter GROUP BY time($__interval) fill(null) - Set the ALIAS BY to Frequency Correction 0
- See example Frequency panel below
View TimeKeeper Logs
- Create Panel for TimeKeeper logs
- Use Visualization Logs
- Select the data source to be timekeeper_db
- Select Measurement to be tk_log
- Select field to be “field(log)”
- Change mean() to Aggregations/distinct()
- Set “FORMAT AS” to “Table”
Note: Steps 3-6 can be replaced by clicking on the pencil to toggle text edit mode and enter:SELECT distinct("log") FROM "tk_log" WHERE $timeFilter GROUP BY time($__interval) fill(null)
Notes
- A time selection in the Offset/Network Delay/Frequency will cause the TimeKeeper logs for that time frame to be visible. However a similar selection in the TimeKeeper logs is not available.
- In the above examples the TimeKeeper logs shows how to enter the InfluxDB query using the UI elements (as opposed to the “text edit mode”). This is easier for developing new panels and allows for easier tweaking of the output. Toggling the text edit mode will cause the resulting query to be displayed.