Timing map and network view
TimeKeeper will by default build a map of your timing sources, their timing sources, and so on, as far as it can reach. It’ll also include details on any other timing data it sees on the network so you have a single view of what your timing estate looks like in practice.
With this data, you can confirm that you really are getting time from the sources you intend to, with the protocols intended, and that the structure of the network matches your design. Many TimeKeeper users have had the timing map identify issues with their network, like having redundant protocols and paths, only to in the end have a single point of failure upstream. Others use it to provide a quick overview of the current accuracy and connectivity of the systems.
An example
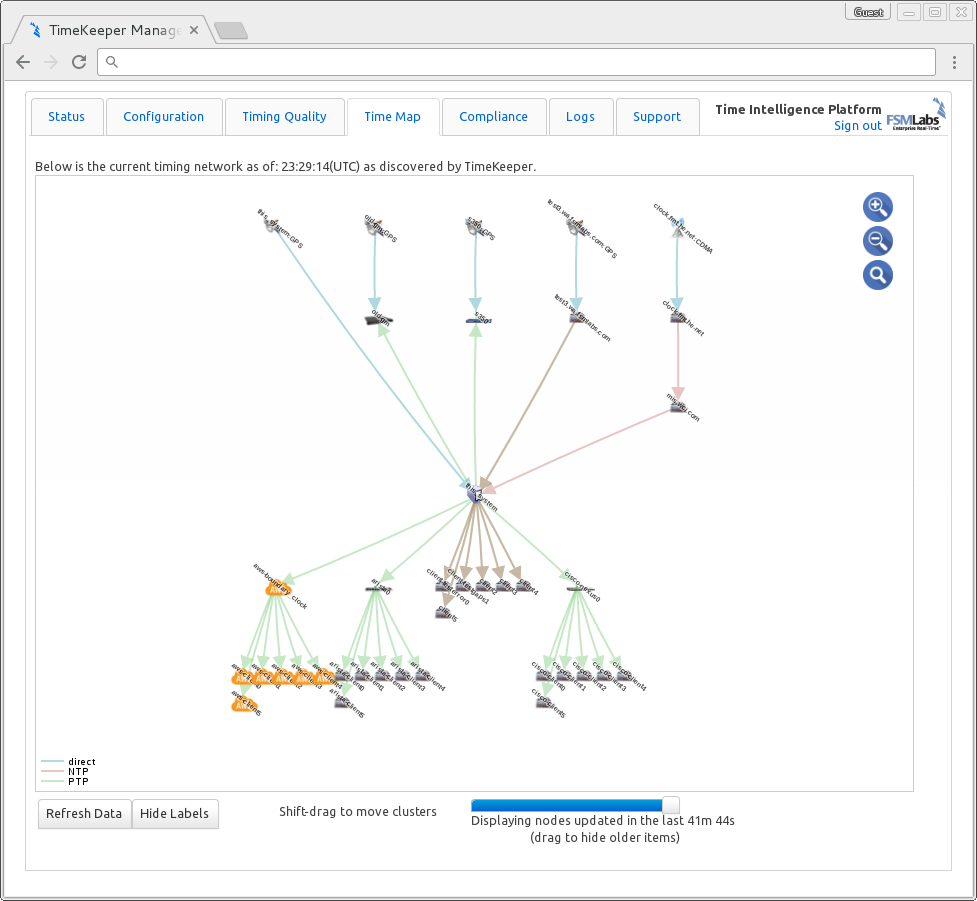
Let’s look in closer detail at the map we saw earlier:

This is intended to give you an overview of the network at a glance, but let’s look in some detail to be clear. The system running the map is centered in the map as ‘this_system’. The connections between it and its sources (going up to stratum 1) are shown by protocol, as is the connectivity to what clients it has downstream.
Specifically, we can see:
- This system has a direct connection to a GPS source
- It’s getting PTP from a host named ‘old_gm’ and an S350
- It’s also getting NTP from two other hosts
- One of these NTP sources is a stratum 1 server with direct GPS connectivity
- The other NTP source is a stratum server for another host that has a CDMA connection
That’s where this system is getting time from. We can also see:
- NTP and PTP are being served downstream
- Some of the clients are hosted in Amazon’s EC2 cloud
- Some clients are connected via an Arista switch, others via a Cisco Nexus
- Some clients are directly connected and getting NTP
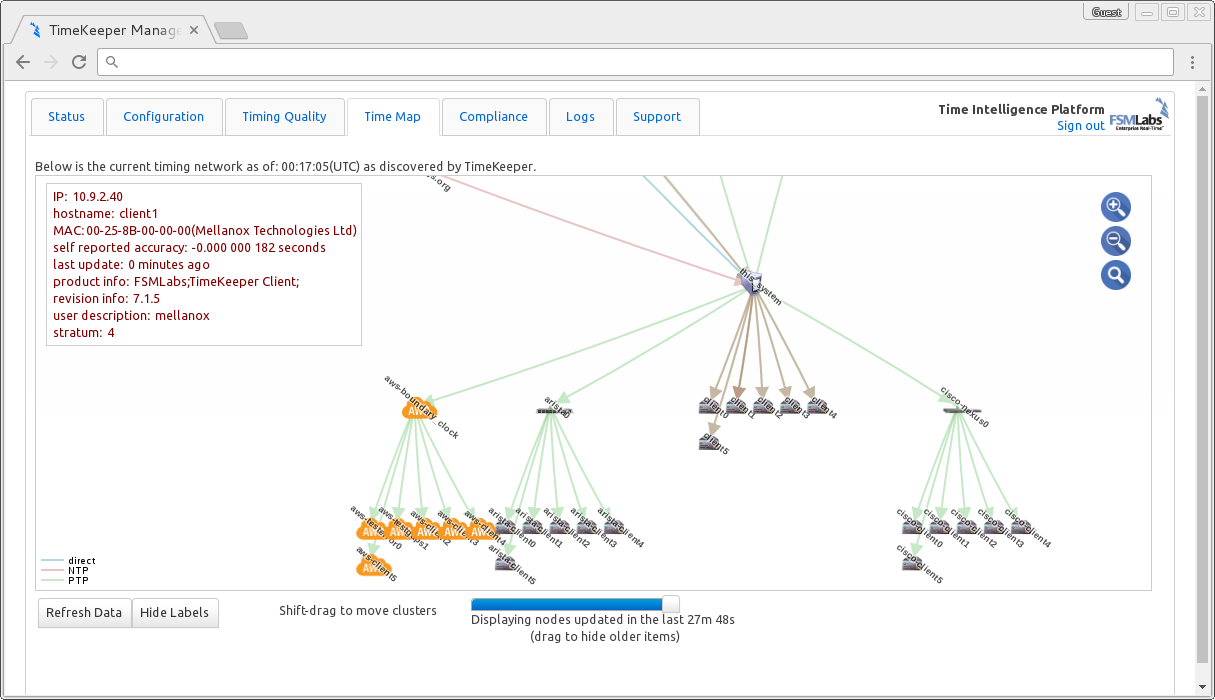
Interactively, each host can be hovered over for more detail on that particular system. Each arc can be hovered over to get delay details. Clusters can be moved, disabled by age, and more using the controls. Here’s an example of a hover over a host:

If there are other timing packets available on the network, but not directly related to this host’s sources or clients, it will still be collected and displayed (like multicast PTP data). TimeKeeper Grandmasters collect information from all clients and Grandmasters on the network, so their maps display all of these map details in one place, for a more complete view.
The timing map can show many useful things, but it’s more interesting with your own data. It’s enabled by default, or by specifying ENABLE_MAP=1 in /etc/timekeeper.conf - so you can run it on your network.